Streaming Platforms Visualization Dashboard
Details:
This was a project done for my Master's course Information Visualization
Source Code:
https://github.com/IsabelaPO/Information-Visualization/tree/main/VI-20Description:
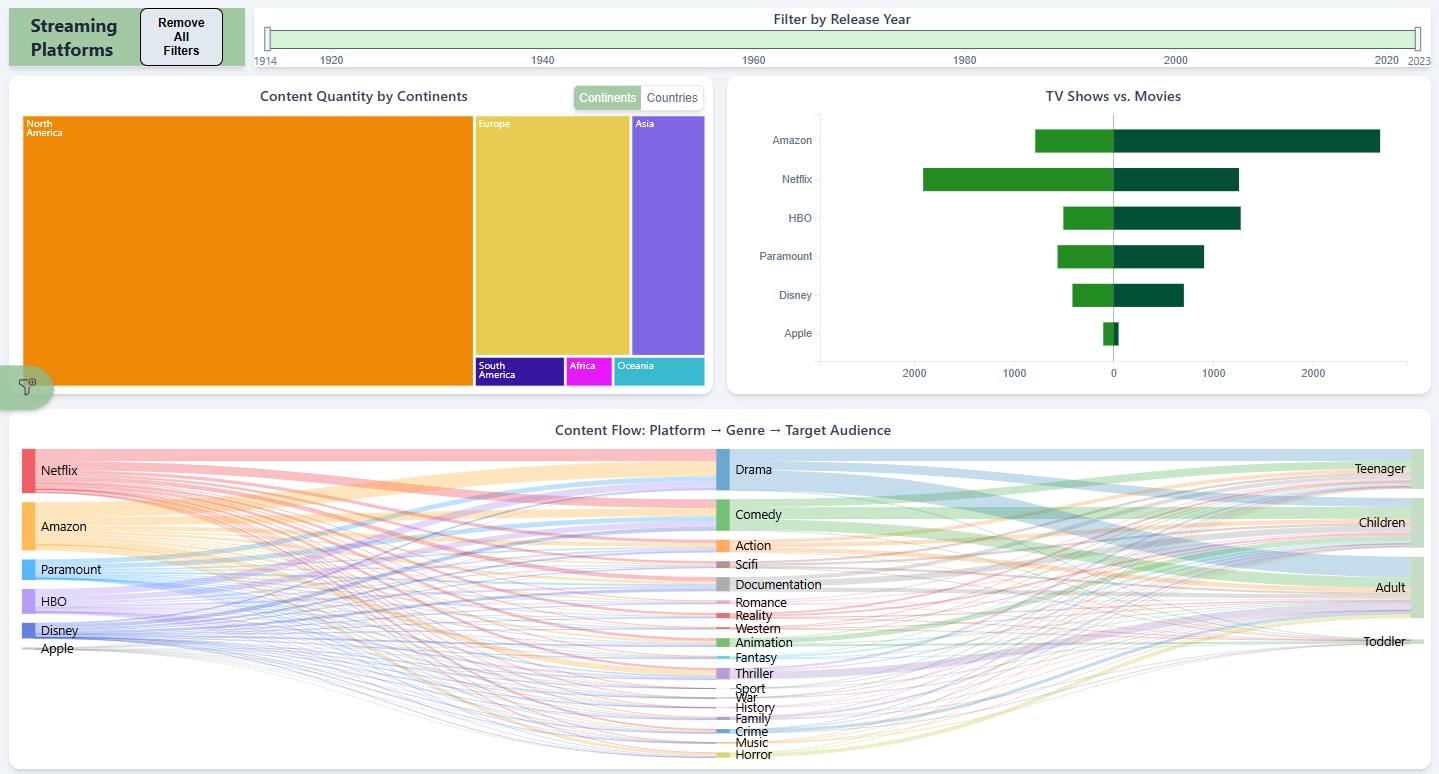
This interactive dashboard visualizes data from the most popular streaming services up to 2024. The project began by defining key questions we wanted to explore, followed by cleaning the dataset to include only the most relevant parameters. Based on these insights, we designed and developed a connected dashboard that allows users to easily explore the data. All charts are fully interactive and linked, making it easy to uncover relationships and trends within the streaming landscape.